Finland's ten most family-friendly areas hold 0.6% of its families
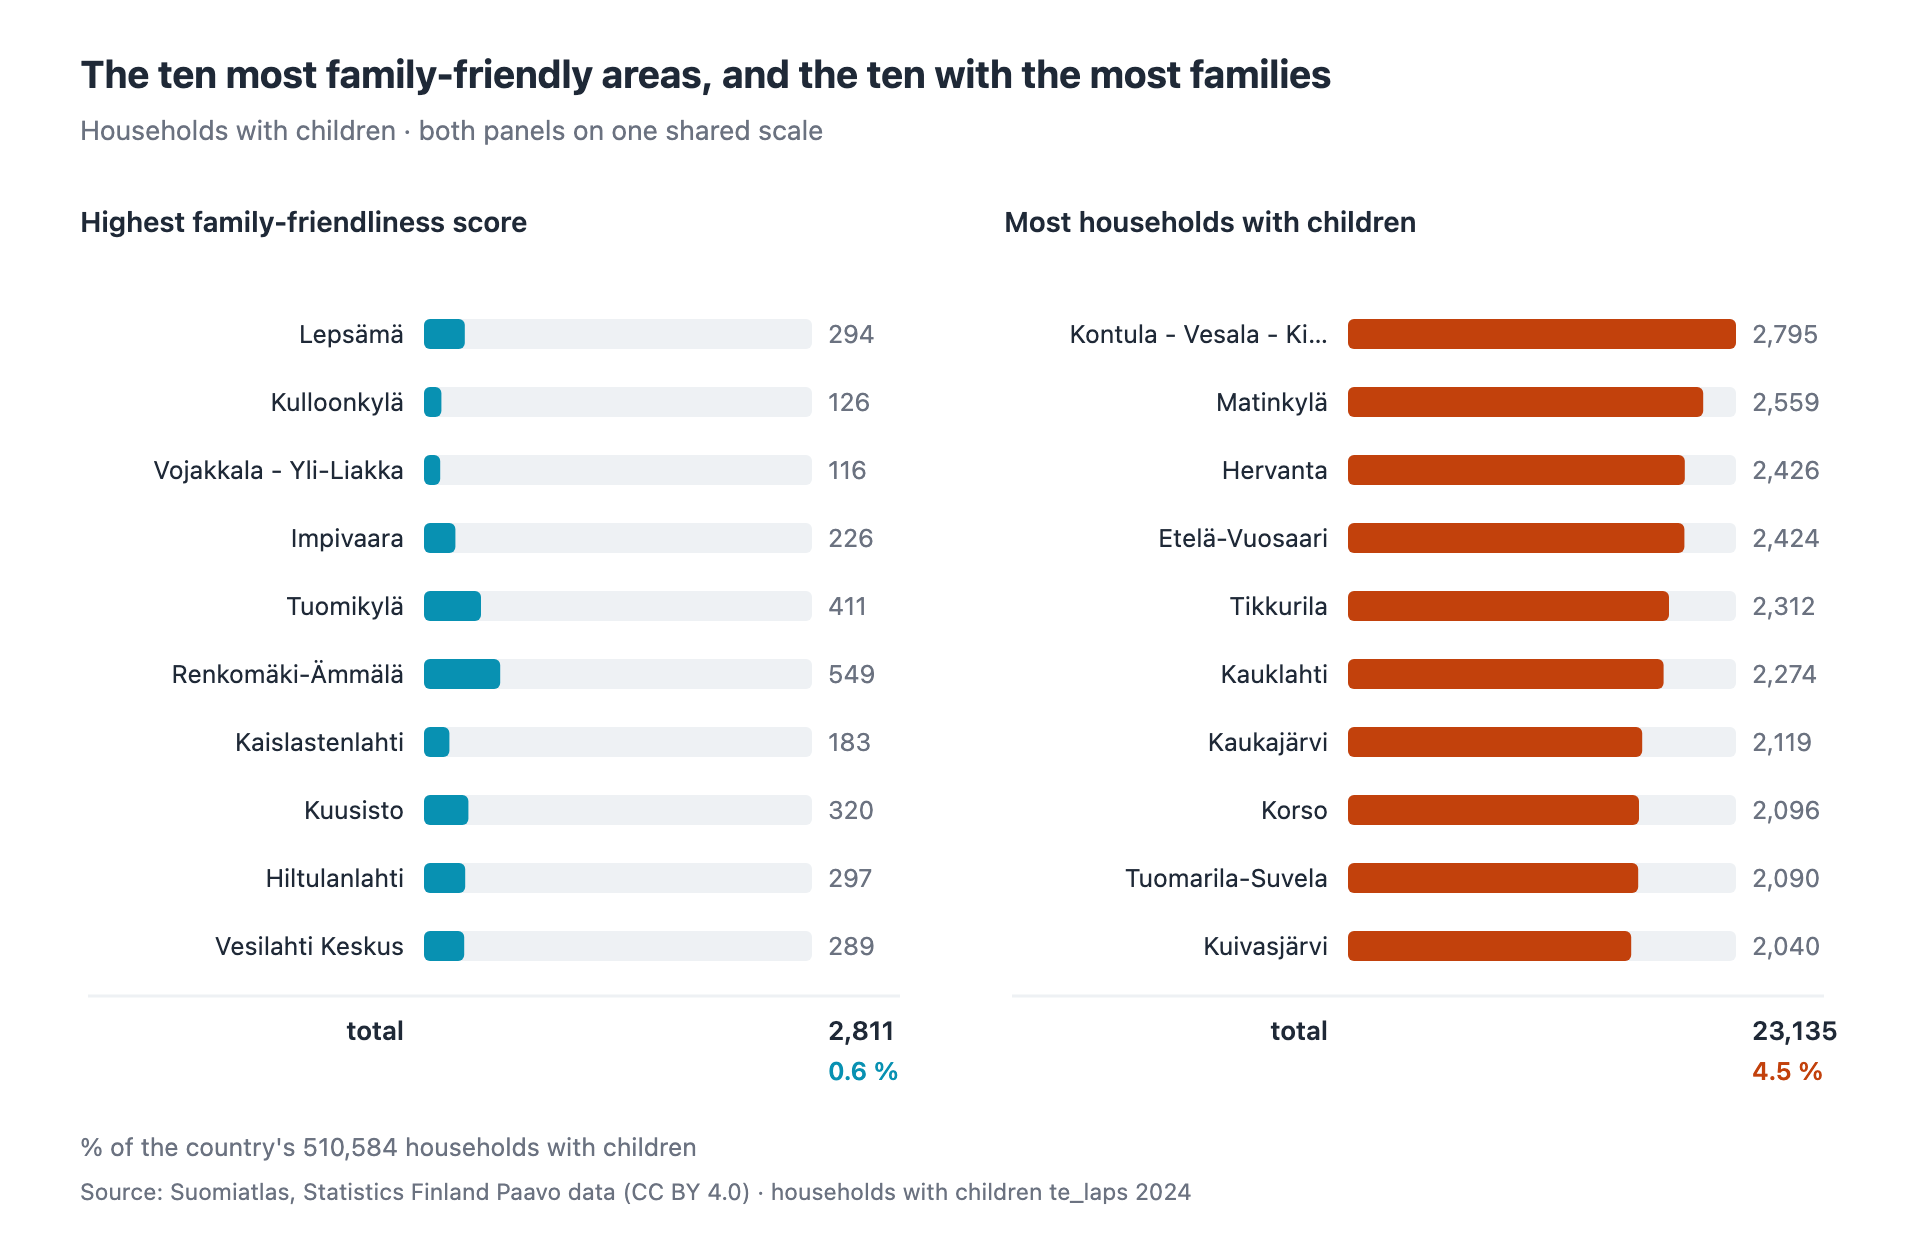
Finland's most family-friendly postal code area is Lepsämä in Nurmijärvi. 294 households with children live there. Kallio in Helsinki has 825, nearly three times as many, and Kallio ranks 1089th of the 1093 areas in the same comparison.
This is not a mistake. The score measures a share, not a count. But the gap is wide enough to be worth saying out loud: the ten highest-scoring areas contain 2811 households with children between them, 0.6 percent of the 510,584 in the comparison.
What the ranking ranks
The family-friendliness score is Suomiatlas's own composite, not an official Statistics Finland measure. It asks what share of an area's households are families and what kind of housing stock they live in. That is a reasonable question, but it is a different question from "where are the families".
A village where 40 households in every 100 have children scores high. A city district where 800 families sit among 12,000 households scores low. Twenty times as many families live in the second one.
Deciles
Sort the areas by score and split them into ten equal groups, and the households with children fall out like this:
| Score decile | Scores | Households with children | Share |
|---|---|---|---|
| 1 (highest) | 65–81 | 32,251 | 6.3% |
| 2 | 58–65 | 46,417 | 9.1% |
| 3 | 52–58 | 46,444 | 9.1% |
| 4 | 49–52 | 55,227 | 10.8% |
| 5 | 44–48 | 56,455 | 11.1% |
| 6 | 40–44 | 54,337 | 10.6% |
| 7 | 36–40 | 52,405 | 10.3% |
| 8 | 30–36 | 58,056 | 11.4% |
| 9 | 23–30 | 56,897 | 11.1% |
| 10 (lowest) | 9–23 | 51,135 | 10.0% |
Nine deciles out of ten hold between 9 and 11 percent of the families. Only the top-scoring tenth departs from that, and it departs downwards: fewer families live there than in any other decile.
The same thing stated statistically: the correlation between the score and the number of households with children is −0.11. The score tells you almost nothing about how many families live in an area.
Where the families actually are
These are the ten areas with the most households with children:
| Area | Households with children | Score | Rank |
|---|---|---|---|
| Kontula – Vesala – Kivikko, Helsinki | 2,795 | 36 | 753 |
| Matinkylä, Espoo | 2,559 | 42 | 609 |
| Hervanta, Tampere | 2,426 | 20 | 1008 |
| Etelä-Vuosaari, Helsinki | 2,424 | 35 | 787 |
| Tikkurila, Vantaa | 2,312 | 23 | 973 |
| Kauklahti, Espoo | 2,274 | 59 | 193 |
| Kaukajärvi, Tampere | 2,119 | 35 | 779 |
| Korso, Vantaa | 2,096 | 40 | 644 |
| Tuomarila – Suvela, Espoo | 2,090 | 49 | 421 |
| Kuivasjärvi, Oulu | 2,040 | 52 | 337 |
Seven of these ten fall below the median score of 43.9. None reaches the top hundred; the highest of them is Kauklahti at 193.
Part of this is population: the number of households with children and the resident count correlate strongly (+0.92), so this list is partly a list of large areas. That is precisely what a share-based score does not show.
Why it happens
Forty percent of the score's weight comes from the housing stock and space per person: the share of small-house dwellings and the floor area per resident. An apartment district scores low on both however many children live there. The other 45 percent measures the share of households that are families, and that share falls as an area gains other kinds of household.
Both pull the same way: a dense area with many families and even more non-families scores low.
What the score is good for
The score answers the question "how family-dominated is this area". For that it is sound, and it describes the character of a neighbourhood.
It does not answer "where are the families". If you are planning a daycare network, a school site or a playground, the count is what matters, not the share. The 2811 households with children in the ten highest-scoring areas are fewer than Kontula and Matinkylä hold between them.
Nor does the score say whether an area is a good place to raise children. No open dataset measures that.
Check it yourself
The dataset carries the score and the number of households with children for each
of the 1093 areas. The household counts come from Statistics Finland's Paavo
variable te_laps for 2024.