About the data and the method
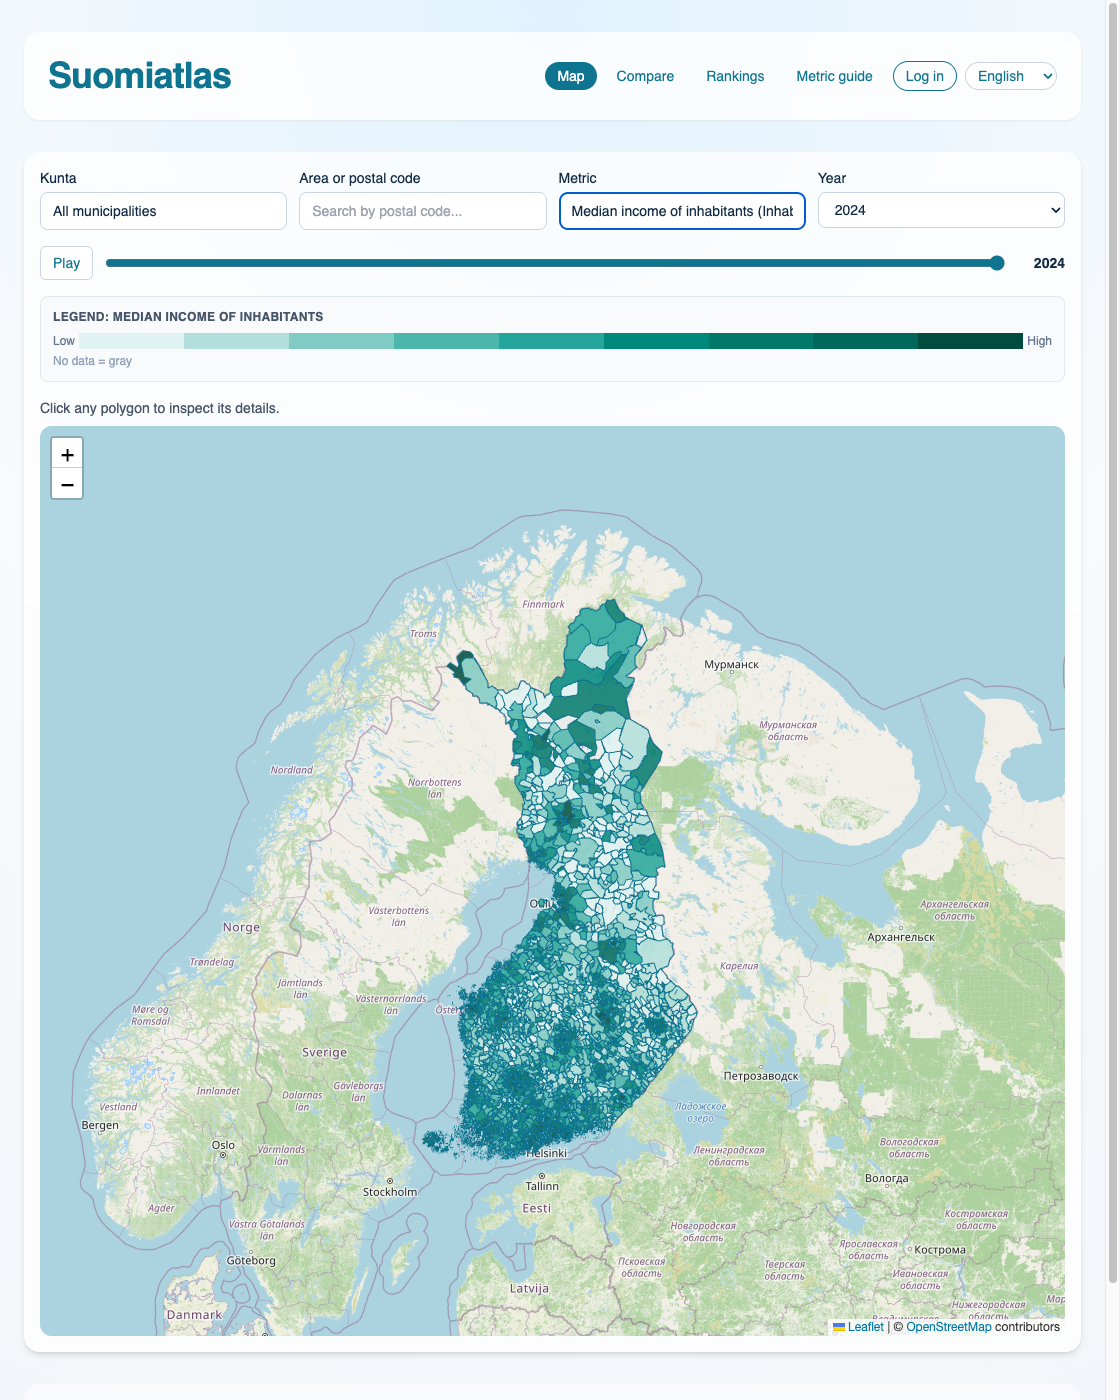
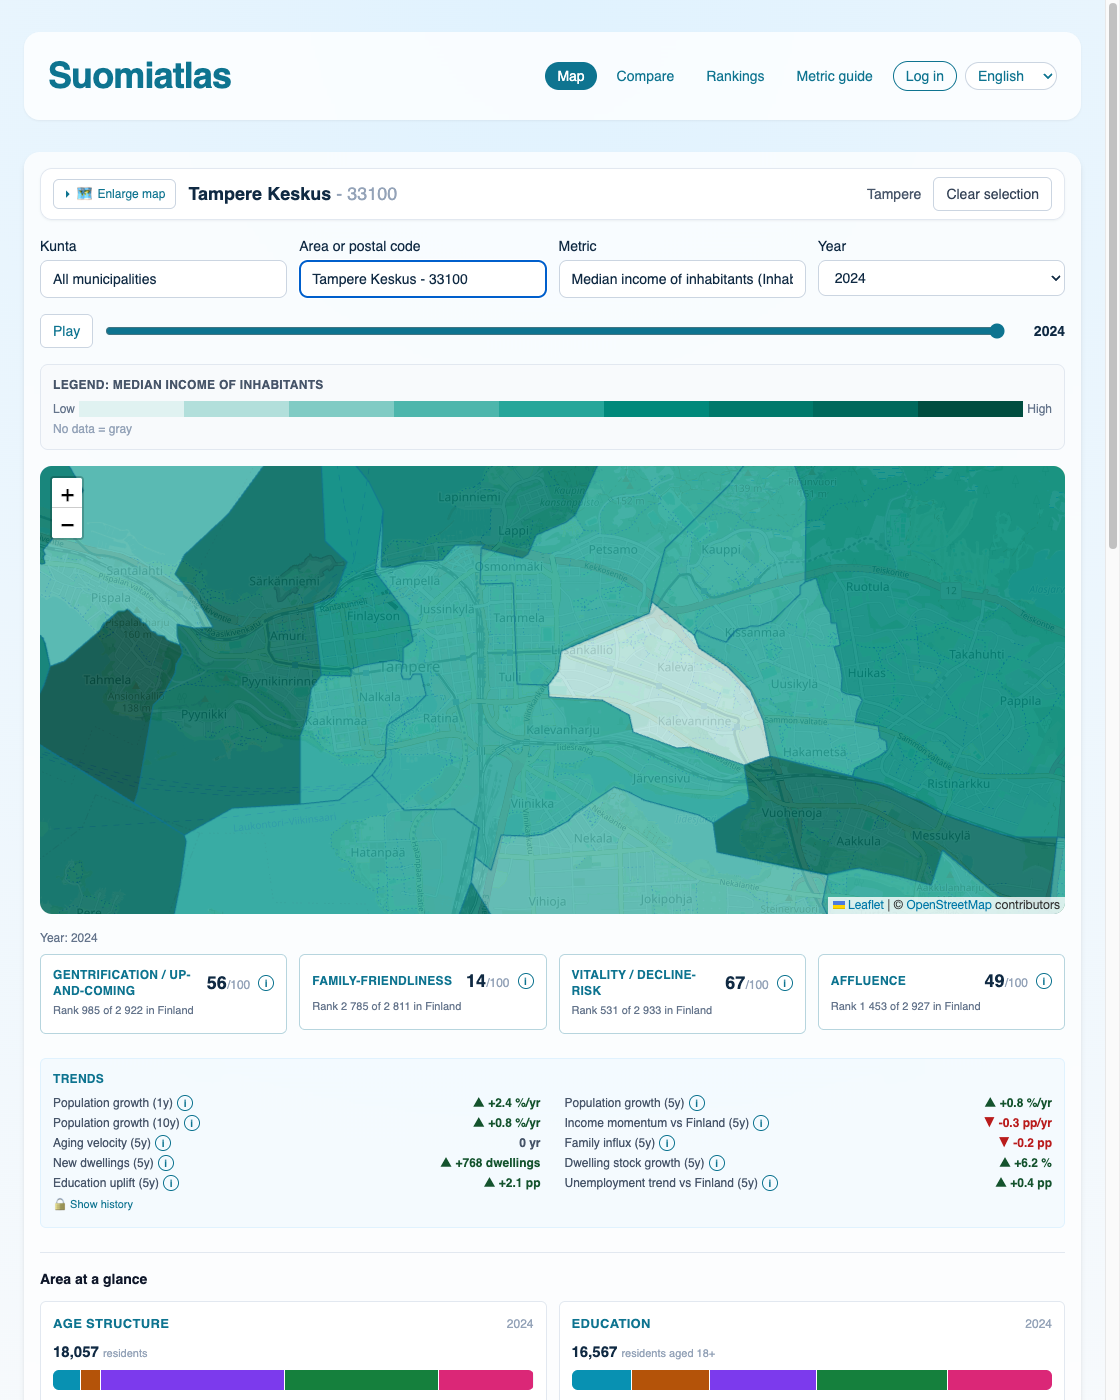
Suomiatlas brings the statistics of Finland's ~3,000 postal code areas onto one map: population, income, education, households, buildings, workplaces, housing sale prices, crime and air quality. Every figure comes from open government data.
What the data covers
The base is Statistics Finland's Paavo dataset: 104 variables for every postal code area, grouped into population, education, income, households, buildings, workplaces and economic activity.
On top of that come realised housing sale prices per square metre, offences recorded by the police, and air quality observations from the Finnish Meteorological Institute.
History goes back to 2010. The newest vintage appears as Statistics Finland publishes it, so the most recent year available is typically a couple of years behind the current one.
How the figures are computed
Paavo variables are shown as published — never rounded, imputed or estimated where a value is missing.
Derived indicators such as the share of higher-educated residents or population density are computed directly from those variables. Composite scores (0–100) rank each component nationally, trim the extremes, and take a weighted mean.
Benchmarks place an area at three levels: the whole country, its municipality, and its region.
What the data cannot tell you
A postal code area is not a neighbourhood. Its boundaries follow postal delivery rather than how residents see the place, and one postal code can contain very different blocks.
Statistics Finland withholds figures for very small areas to protect privacy. A withheld value appears as missing, never as zero. Trend indicators are not computed for areas under 30 inhabitants.
Crime figures are municipal. Police record offences per municipality, so a postal code area shows its municipality's rate, not its own.
Air quality is the nearest measuring station's reading, and the station's distance is always shown alongside it. It is not a measurement taken inside the area. The stations are mostly run by municipal air quality networks — HSY's in the capital region — and the Finnish Meteorological Institute distributes the observations.
Workplace statistics are published about two years behind the rest of Paavo.
Composite scores are unstable for very small and non-residential areas, such as hospital or industrial postal codes.
The figures show co-occurrence, not causation — worth keeping in mind especially when comparing income and crime.
Data sources
| Dataset | Publisher |
|---|---|
| Paavo — open data by postal code area (statistics and boundaries) | Statistics Finland |
| Dwelling prices (ashi) | Statistics Finland |
| Offences recorded by the police (rpk) | Statistics Finland |
| Air quality observations | Finnish Meteorological Institute and municipal air quality networks (incl. HSY) |
Licence and attribution
All data shown here is open and licensed under CC BY 4.0. Figures, tables and charts may be reused freely, including commercially, as long as the source is credited: the original publisher and Suomiatlas. Machine-readable licence details are available at /api/v1/license. Read the licence terms
For press
The paragraph below is meant to be copied as it stands, and the logos and screenshots may be published without asking. Per-area figures and ready-made charts are available by email — usually the same day.
Ready-to-use paragraph:
Suomiatlas is an open-data service that brings the statistics of Finland's ~3,000 postal code areas onto one map: population, income, education, housing prices per square metre, crime and air quality. The data is open data from Statistics Finland and the Finnish Meteorological Institute, published under CC BY 4.0.Get in touch →