Suomiatlas's five-year change is highest in Koskela, Helsinki
"Five-year change" is the name of a Suomiatlas metric, not an official statistic. Suomiatlas computes it — you will find it under that name on any area's page on the site — and it answers one narrow question: over five years, how have this area's incomes, education level, young-adult share and owner-occupancy moved, and how much has been built? Then: how does that compare with other areas in Finland?
What a high score does not tell you. It does not mean the area became more expensive, and it does not mean anyone was pushed out. Those are what people usually mean by gentrification, and this metric measures neither: housing prices are not one of the five signals, and it follows areas rather than people. Read a high score as one partial signal, not a verdict about a neighbourhood.
Leaving prices out is a deliberate choice rather than a gap, and the data explains why. Among the 400 areas in this list where a two-room flat's €/m² can be compared at both ends of the window, the score has only a weak relationship with what happened to prices, and the median area's price per square metre fell by about 4% in nominal terms. The window spans the fall after the 2022 peak, so a price signal here would have measured the national housing cycle more than any individual neighbourhood. Prices come from a separate Statistics Finland dataset — dwelling sale prices, not the postal code statistics the five signals are built from — and are shown per area on the site, so the two can be read side by side rather than one inferred from the other.
That also makes it a different question from "is this a nice area" or "is this an expensive area", and the difference is easy to see. Kaivopuisto - Ullanlinna in Helsinki has a median income of €36,332, among the highest in the country against a national median of €26,312. It scores 44, which places it 649th of 1,080. Koskela, top of the list at 92, has a median income of €26,753 — barely above the national middle.
Kaivopuisto is not falling behind. It has already arrived. An area that was affluent five years ago and is affluent today has not changed, and change is the only thing this metric can see. Koskela scores high because five separate things moved at once.
Those five, and how much each counts:
- Income change — the annual change in median income — 30%
- Education-level change — the share with a higher degree — 25%
- Young-adult share change — ages 20–34 — 20%
- Dwelling count change — 15%
- Owner-occupancy share change — 10%
Each is measured over five years, ranked against every other area in Finland, and then combined into one number. 50 sits in the middle of the comparison set. A score in the nineties means the area placed above almost every other on the weighted whole; a score in the teens means it fell well behind the rest of the country. The score is a placing, not an amount: an area where all five measures rose can still score low, if they rose more elsewhere.
Housing prices are not in the score. Neither is any judgement about whether these changes are good for the people already living there. The metric describes what changed, not who benefited — and it cannot tell you whether anyone was priced out, because it follows areas rather than people.
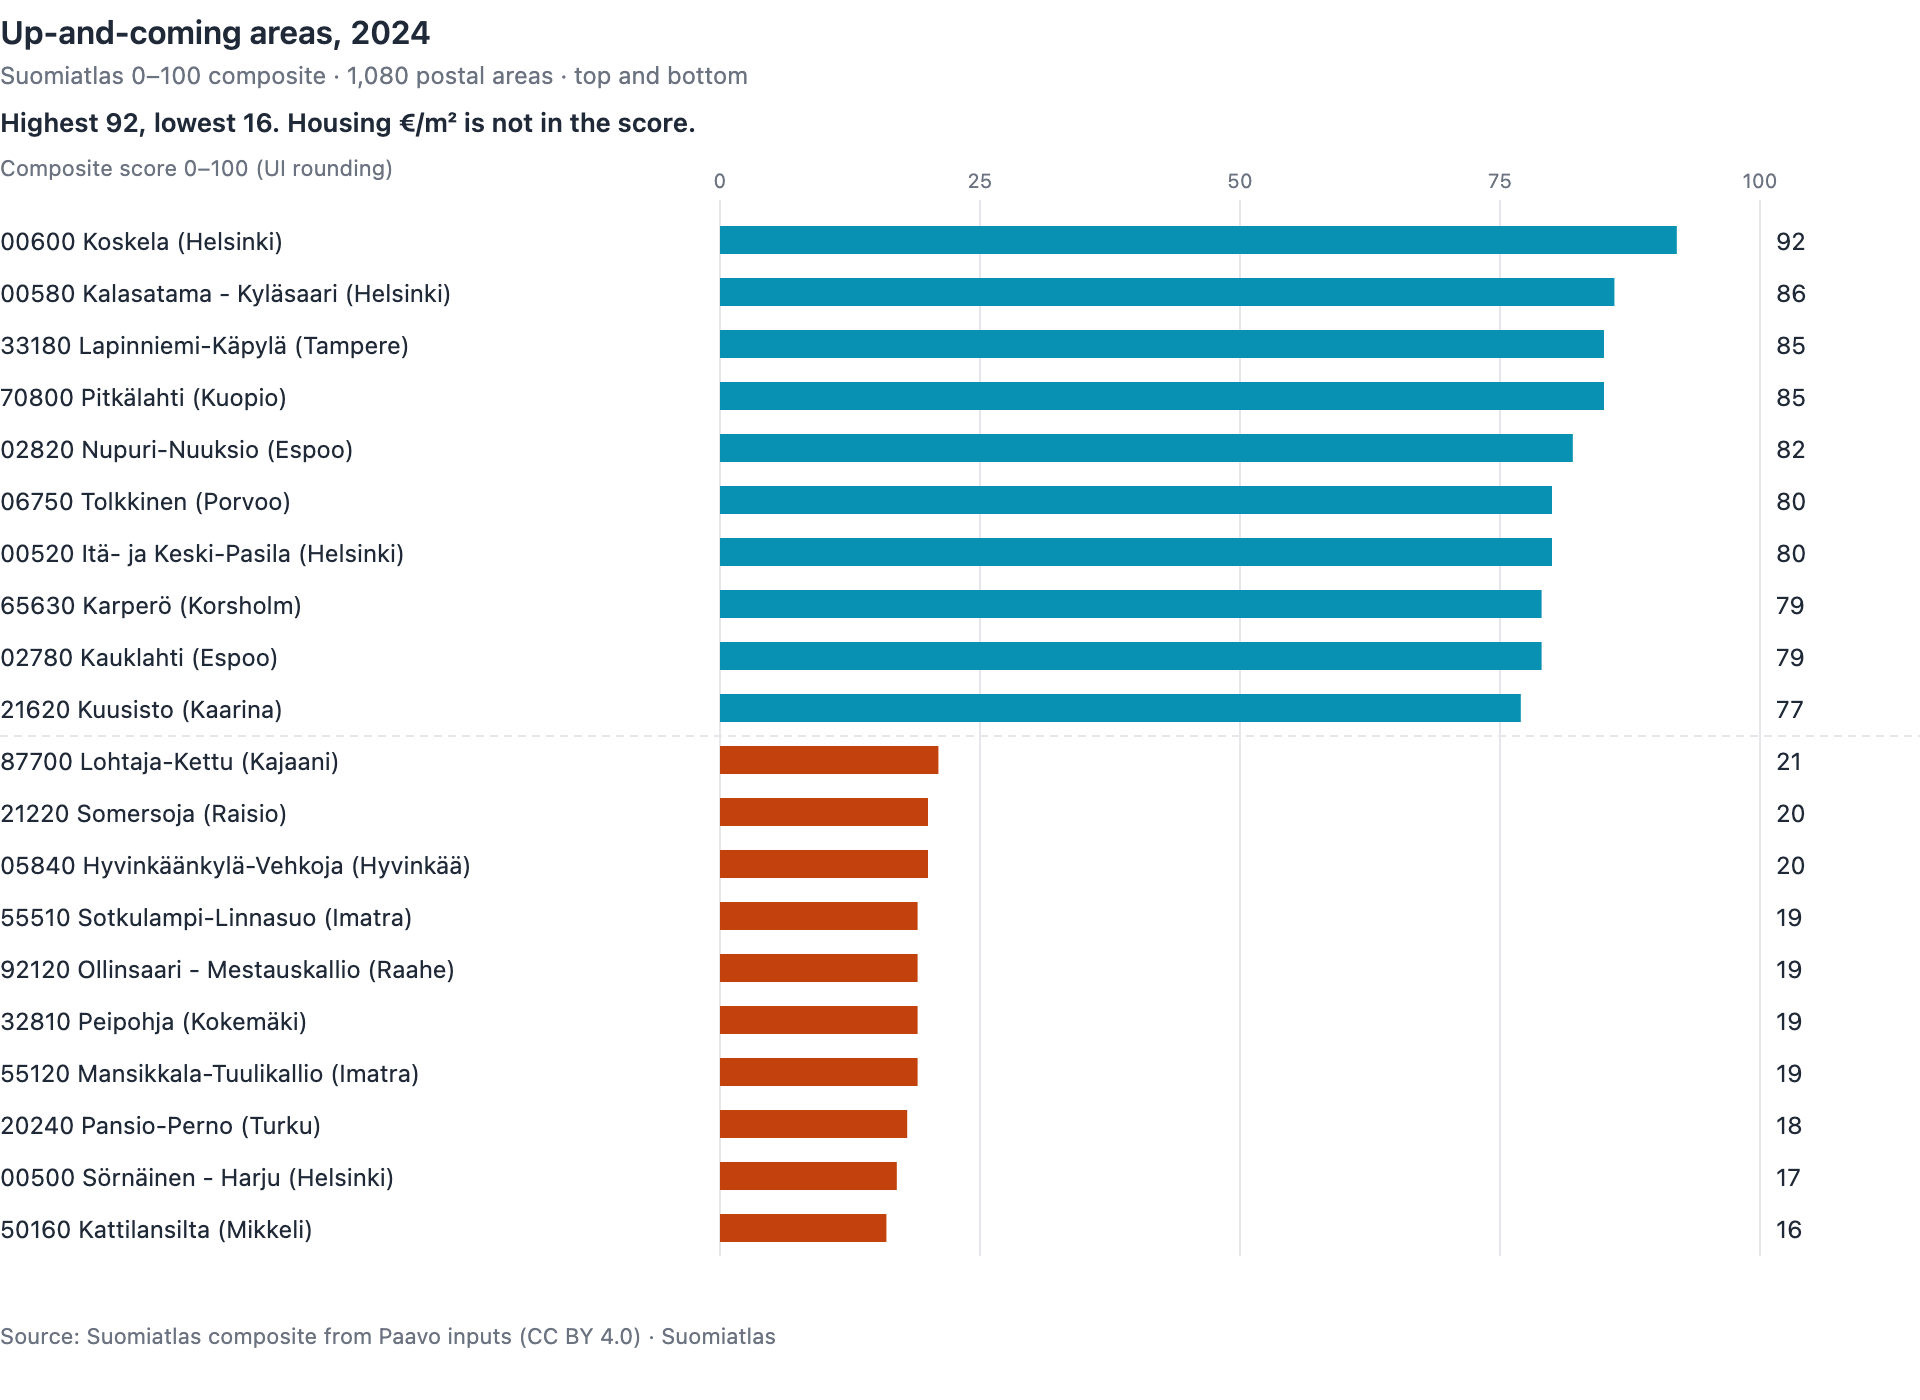
Koskela in Helsinki has the highest five-year change of any postal code area in Finland, and five of the top ten are in Helsinki or Espoo. Of 1,080 areas with at least 1,000 residents, Koskela scores 92 on Suomiatlas's 0–100 five-year change composite for 2024; the lowest is Kattilansilta in Mikkeli at 16. The median is 47.
Koskela's placing did not arrive suddenly. It has climbed almost every year for a decade — 139th in 2015, then 99, 100, 66, 59, 29, 3, 2, 2 and first in 2024. That is the clearest single trajectory in the dataset, and it is what the composite is meant to detect.
The top ten
| Rank | Postal code area | Municipality | Score | Residents |
|---|---|---|---|---|
| 1 | 00600 Koskela | Helsinki | 92 | 4,722 |
| 2 | 00580 Kalasatama - Kyläsaari | Helsinki | 86 | 8,148 |
| 3 | 33180 Lapinniemi-Käpylä | Tampere | 85 | 4,300 |
| 4 | 70800 Pitkälahti | Kuopio | 85 | 4,203 |
| 5 | 02820 Nupuri-Nuuksio | Espoo | 82 | 1,708 |
| 6 | 06750 Tolkkinen | Porvoo | 80 | 2,071 |
| 7 | 00520 Itä- ja Keski-Pasila | Helsinki | 80 | 8,732 |
| 8 | 65630 Karperö | Korsholm | 79 | 1,333 |
| 9 | 02780 Kauklahti | Espoo | 79 | 14,251 |
| 10 | 21620 Kuusisto | Kaarina | 77 | 2,278 |
Seven municipalities are represented, so this is not only a capital-region story — but the capital region holds five of the ten places, and only seven of the top 25. Ranks 3 and 4, and 6 and 7, share a displayed score because the underlying values round to the same whole number; the order still separates them.
The steepest single climb in the top ten is Kalasatama - Kyläsaari's, and the reason is visible in its population: 3,479 residents at the start of the window, 8,148 at the end, a 134% increase. It ranked 623rd in 2018 and 13th in 2019 — 610 places in one year — then first or second every year since. A district being built does not drift up a ranking; it jumps.
Which areas are counted, and which are not
Two cohorts, and they are easy to confuse. Suomiatlas computes this metric for all 2,918 areas where it can be calculated at all, with no population requirement. This article ranks 1,080 of them: those with at least 1,000 residents both at the start of the five-year window and at the end.
The floor is applied at both ends deliberately. Requiring 1,000 residents only in 2024 would admit an area on the population it finished with while scoring it on how much it changed — and three of the five signals reward exactly that arrival. So the ranking here is not the site's own ranking: Koskela is first in this article and tenth across all 2,918. Every row of the downloadable data carries both, for anyone reconciling the two.
Twelve areas crossed 1,000 residents during the window and are therefore held out of the ranking rather than dropped from the story. Most do not score highly, which is itself worth knowing — growing past a thousand people does not by itself lift an area's score:
| Newly counted area | Municipality | Score | Residents, start → end |
|---|---|---|---|
| 13330 Harviala | Janakkala | 82 | 889 → 1,021 |
| 02390 Sarvvik | Kirkkonummi | 60 | 654 → 1,330 |
| 00880 Keski-Herttoniemi - Roihupelto | Helsinki | 52 | 719 → 1,934 |
| 20730 Skanssi | Turku | 40 | 764 → 1,387 |
Harviala would have placed fifth had it been included. The full twelve are in a separate CSV.
How much to trust a single rank
The order is dependable at the top and much looser in the middle. Year to year, an area in the top 25 moves a median of 9 places; an area ranked between 401 and 800 moves a median of 136. Scores across the whole cohort shift by a median of 4 points out of 100 from one year to the next — but in the crowded middle of the distribution, four points crosses hundreds of areas.
So if you look up your own area and find it has moved a hundred places, that is normal for the middle of this list and does not mean much. Movement at the top does.
Every figure here is for 2024. That is as recent as this metric goes, because Paavo — the Statistics Finland dataset behind most of the five signals — is published up to 2024.
The series starts in 2015 for the same reason at the other end: Paavo begins in 2010, and the score needs a five-year window. So an area's earliest rank is not where its change began, only where measuring it begins — a shift already under way in the 2000s does not appear here.
Check it yourself
The full 2024 ranking downloads as CSV above: nouseva-alue-2024.csv. Every row carries the score, both population figures, the rank across all 2,918 areas, and how many of the five signals were available. Any single area's score and that rank can also be read from the Suomiatlas map by opening the area and looking at its composite scores.
Source: Suomiatlas five-year change composite, computed from Statistics Finland's Paavo postal code statistics; the €/m² figures quoted above are Statistics Finland's dwelling sale prices. Both CC BY 4.0. Chart and data may be republished with attribution.
Renamed 9 October 2026: when this article was published the metric was called "Up-and-coming". It was renamed because that named the area rather than the measurement — the metric sees a five-year change, not where an area is heading. The method, the components and every figure in this article are unchanged.
Analysis: Suomiatlas. Questions and corrections: [email protected]
Postal code areas in this article
- Koskela (00600)
- Kalasatama - Kyläsaari (00580)
- Lapinniemi-Käpylä (33180)
- Pitkälahti (70800)
- Nupuri-Nuuksio (02820)
- Tolkkinen (06750)
- Itä- ja Keski-Pasila (00520)
- Karperö (65630)
- Kauklahti (02780)
- Kuusisto (21620)
- Harviala (13330)
- Sarvvik (02390)
- Keski-Herttoniemi - Roihupelto (00880)
- Skanssi (20730)