Nearly a third of homes in four Rautavaara postal areas have no permanent resident
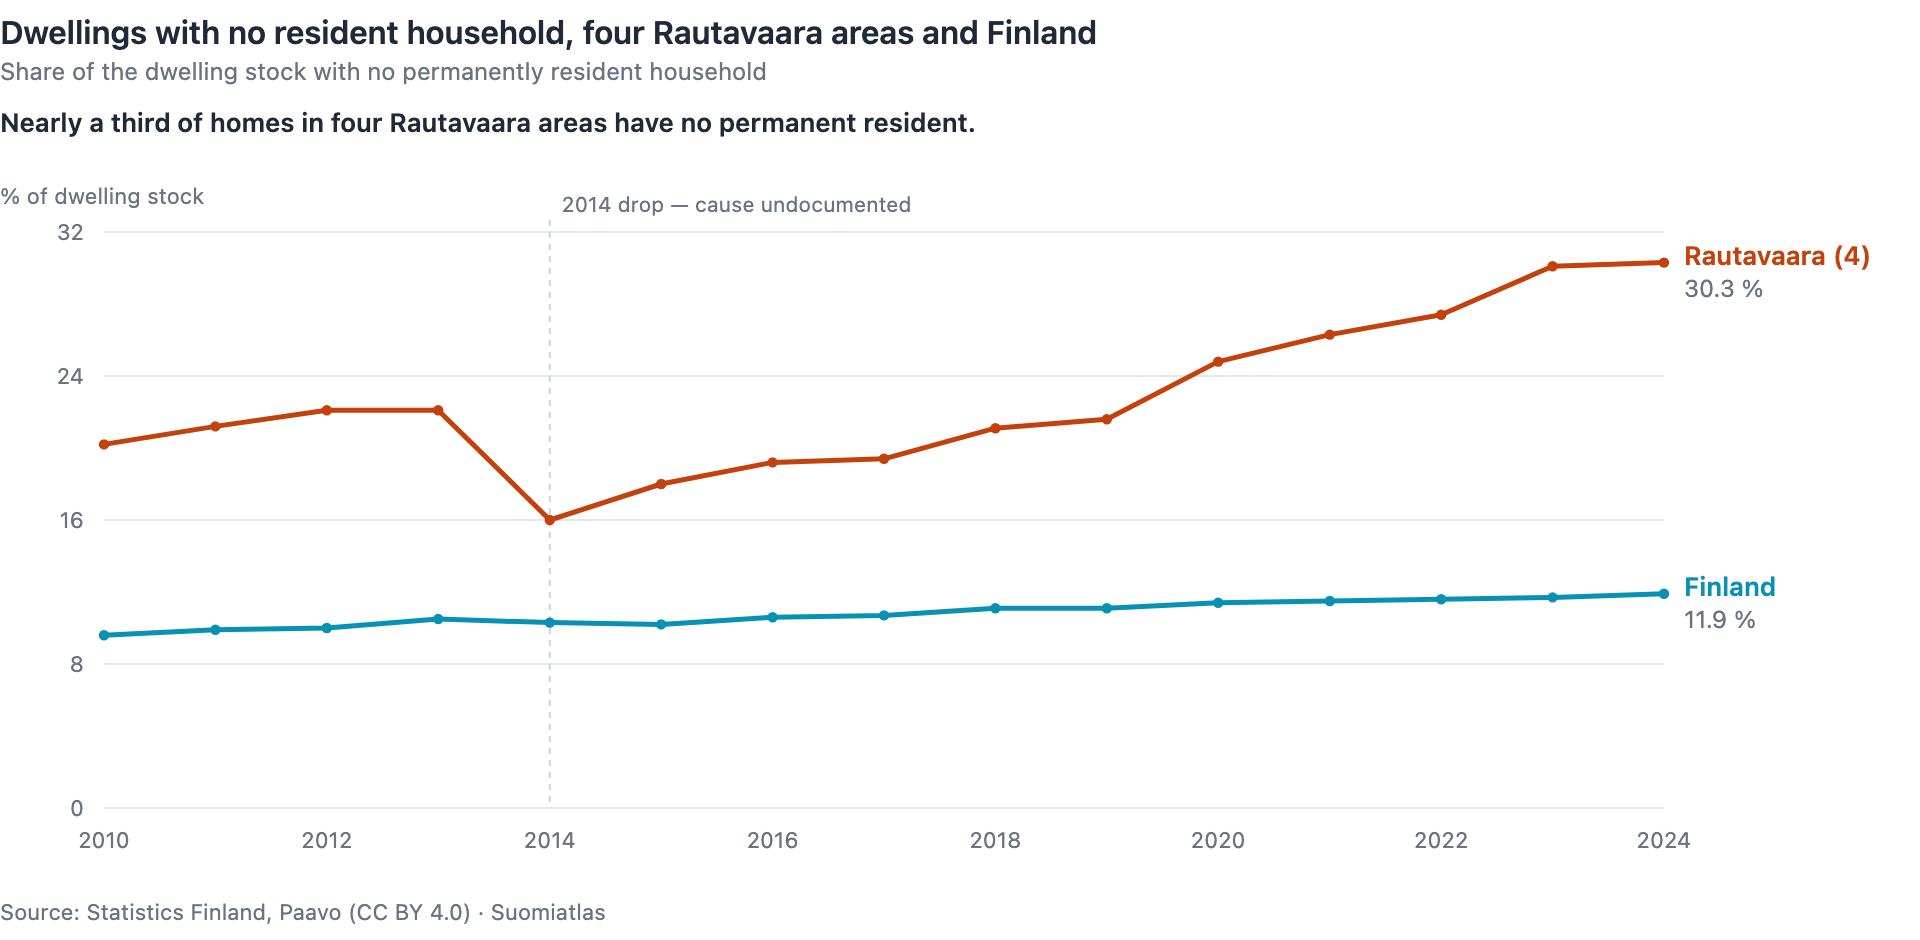
In the four Rautavaara postal code areas that publish both figures, there were 1,110 dwellings and 774 households in 2024. 336 dwellings — 30.3 % of that stock — have no permanently resident household. The same calculation for the whole country gives 11.9 %.
Those four areas hold 1,397 of the 1,405 people living in Rautavaara's five postal code areas. The fifth, Riitasalo, publishes 5 households but no dwelling count, so it cannot enter the ratio and no exact figure can be computed from published data. Coverage varies from figure to figure rather than being uniform, and the caveats set out which spans what.
Helsingin Sanomat visited Rautavaara and described a family who bought a row house flat of nearly a hundred square metres in the village centre for €6,000. These figures do not explain that particular sale — no transaction-level data here could — but they describe the market it happened in.
What the figure counts
The dwelling stock is every dwelling, occupied or not. A household-dwelling unit is the people permanently resident in one. The difference is dwellings nobody lives in permanently: empty, in summer use, or otherwise outside the permanent housing market.
The rise is mostly households disappearing, not building. Between 2014 and 2024 the stock grew from 1,078 to 1,110 while households fell from 906 to 774 — 32 more dwellings, 132 fewer households. The empty share went from 16.0 % to 30.3 %. Had the stock stayed at 1,078, the same household loss would have produced 28.2 %, so net stock growth accounts for about 2.1 of the 14.3 percentage points. The data cannot separate new building from demolition or register changes within that net figure.
The housing market is too thin for the statistic to describe it
Across five postal code areas and 17 years, Statistics Finland has published one square-metre price for any Rautavaara postal code area: row houses in 2014, €460 per square metre, on six transactions. The national row house figure that year was €2,097.
Six transactions was not the highest count on record. Rautavaara Keskus, the central postal code area with about 80 % of the municipality's residents, alone saw nine row-house sales in 2009 with no published price, and seven in 2010. So publication is not a simple transaction threshold: Statistics Finland also excludes some sales from price calculation and suppresses figures for other disclosure reasons. A missing price does not mean nothing was sold.
The counts are small either way. Across the three Rautavaara postal code areas that have any data in the price table, no year's total of transactions included in the statistics exceeds ten: five in 2024, one in 2025. The table has no cells at all for the other two areas. And these are sales of old dwellings in housing companies only — flats and row houses. Detached houses and plots are outside the price statistic altogether. They are not outside this article: the dwelling stock behind the 30.3 % counts every dwelling type, and in those four areas 985 of the 1,110 dwellings are in small houses.
The same publication limit excludes much of Finland from the dwelling price statistics: the 2025 table covers 1,724 postal code areas of Finland's ~3,000, and publishes a price for 793 of them.
The population is shrinking and ageing
Residents of the five postal code areas fell from 1,862 to 1,405 between 2010 and 2024. The municipal register, which does not share their boundaries exactly, counts 1,872 and 1,413 for the same years. Under-15s went from 194 to 115, and just 15 children under three are recorded — counts from the four areas that publish them, so read as a floor rather than an exact total. In the four areas that publish age data, the share aged 65 or over rose from 31.7 % to 43.9 %, against 17.6 % to 23.7 % nationally. The average age is 55.8 against 44.1.
There are 524 holiday homes across the five areas, two thirds as many as the 779 households those same five areas report.
The income figure that gets quoted
Rautavaara Keskus is the seventh lowest-income postal code area in Finland, out of the 1,093 with at least 1,000 residents. Its median income in 2024 was €19,774.
The six areas below it show that a low median income means at least two different things. Finland's lowest-income postal code area is Otaniemi in Espoo: a median income of €12,135, €7,639 less than Rautavaara Keskus. Students are 40.5 % of its residents, the average age is 27, and pensioners are 1.3 %. Second on the list, Kaijonharju-Linnanmaa in Oulu, is 25.6 % students.
The two are not comparable places, only comparable measurements. Otaniemi holds 1.5 % of Espoo's residents and is an outlier inside it — Espoo's next-lowest area is €26,218, and the median across its 42 areas above the same resident floor is €32,278. Rautavaara Keskus has 1,123 residents, against 1,405 across the municipality's five postal code areas and 1,413 in the municipal register, which counts on slightly different boundaries. Either way it dominates Rautavaara as Otaniemi does not dominate Espoo. That does not make its median the municipality's — a median over most of a population is not the median of all of it — but it does mean these are not comparable places, only comparable measurements. A postal code area can be a campus inside a wealthy city or most of a small town.
The other four are nothing like that. Karhuvuori and Hovinsaari in Kotka, Sotkulampi-Linnasuo in Imatra and Liipola in Lahti have average ages of 44 to 50 and pensioner shares between 28.8 % and 37.3 %.
Rautavaara Keskus sits at the far end of that second group: average age 56, students 4.4 %, residents aged 18–29 just 5.2 %, and pensioners 51.0 % of the population — the fifth highest share of the areas compared.
So the same median-income indicator describes two very different population structures. The natural reading is that in Otaniemi a low median income reflects a stage of life, and in Rautavaara Keskus an age structure — but that is an interpretation, not a finding. These are single-year snapshots; they do not follow anyone over time or show that either pattern causes the median.
What the numbers do not say
The covered income indicators do not show Rautavaara Keskus getting poorer relative to the rest of the country. Rautavaara Keskus's median income rose from €13,468 to €19,774 between 2010 and 2024, or 46.8 %, while the national figure rose 41.1 %, from €18,645 to €26,312. That is an annualised growth advantage of 0.29 percentage points — 2.78 % a year against 2.49 %. Its level relative to the country went from 72.2 % to 75.2 %, a gain of 0.21 percentage points a year.
Measured in euros the gap still widened: from €5,177 to €6,538. Both are true, and neither is enough on its own.
The position of the four postal code areas publishing income-class data has barely moved either. In 2024, 31.1 % of adults in those areas were in the country's lowest income class; in 2010 it was 31.4 %. Nationally the share is 19.6 % in both years. Three broad classes cannot describe a whole distribution; what they show is that these indicators do not register any slippage relative to the country.
Nor does the empty-dwelling share say how many homes are for sale. The statistic records that nobody is permanently resident — not that the dwelling is on the market.
Caveats
The 2014 drop in the chart needs stating plainly. The recorded stock of Rautavaara's postal code areas fell from 1,170 to 1,078 in a single year, in all four reporting areas at once, while the national stock rose. That pattern is consistent with a register correction rather than 92 homes leaving the market, but Statistics Finland does not document it and this article cannot prove the cause. It matters because 2014 is the low point of the series: measured from there the share rises 90 %, and from 2010 — when it was 20.2 % — it rises 50 %. Both are stated so the choice of baseline is visible rather than buried.
Dwellings and households are summed only over the areas that publish both. The Paavo dataset withholds small figures to protect privacy, and each data group has its own test: population figures below 30 residents, income and education below 30 adults, household figures below 30 households, and dwelling figures where the area has fewer than 10 dwellings or only one residential building. Group totals are never withheld, and neither are free-time residences. Riitasalo, with 8 residents, therefore publishes its household total of 5 and its resident count, but not its dwelling count. Counting those households against a stock that omits their dwellings would understate the share. So 30.3 % is the exact published ratio for those four areas, covering 1,397 of the 1,405 people in Rautavaara's postal code areas. It is not the municipal figure, and the municipal figure cannot be computed from published data at all. On the mixed basis it would read 29.8 %. The matched rule is used everywhere in this article, including the national comparison, where it changes nothing at one decimal.
Ages, pensioner shares and income classes are treated the same way: their denominators cover only the areas publishing the numerator. Riitasalo's are suppressed, so it is absent from those shares too.
Some of the empty dwellings are in recreational use. Purpose-built holiday homes are counted separately, but a former permanent home now used as a summer place appears in the dwelling stock with no residents. In a municipality with tourism, like Rautavaara, that lifts the share.
The €25,946 quoted by HS is household disposable income; the income figures above are per-resident medians. The Paavo dataset carries household figures too. Across the four postal code areas publishing them, the household-count-weighted average of area median household incomes is €30,236 and the weighted average of area mean household incomes is €36,809; weighted average household size across the same areas is 1.75. Note what those are: averages of area figures, not a median for the municipality — the same distinction this article insists on for the national benchmark.
The household measure sits well above the per-person one, as it should, and HS's figure is below both. The remaining gap is grain and definition: a municipal statistic is not the same object as an aggregate of postal code areas. None of these can be derived from another.
The national income figure is a population-weighted median of area medians: the level with half the adults of the covered areas living in areas whose median is lower. Those areas hold 99.97 % of Finland's adults. That is not the same as the income below which half of Finland's adults fall, and it should not be read as one — Statistics Finland publishes a person-level national median separately. A weighted mean of the same column gives €26,774. Both are defensible summaries of the same column; mixing them between articles is not, so every article here uses the median.
In small areas even a single move can change the median, so the income comparison is limited to areas with at least 1,000 residents. Rautavaara's other four postal code areas have 8 to 113 residents and fall outside it. They are included in the postal-area aggregates wherever the Paavo dataset carries their values.
The Paavo dataset assigns each postal code to whichever municipality holds the largest share of its surface area, so a postal aggregate is not a municipal total and a cross-border area can be filed under a municipality where few of its residents live. That is why no municipal ranking appears here. The CSV carries the Paavo dataset's attribution unchanged.
This article does not judge Rautavaara as a place to live, and does not forecast prices.
Check it yourself
The series for Rautavaara's postal code areas, 2010–2024, is downloadable as CSV above: population, the adult-weighted average of area median per-person incomes, mean income per adult, household incomes, the national median, dwelling stock and households, the empty share for those areas and for Finland, holiday homes and age structure by year. The chart is drawn from that same file.
Its columns are aggregates of postal code areas, not municipal totals, and the coverage is per variable
rather than uniform. Residents and holiday homes span all five areas. The CSV has no separate adult-count
column; the adult counts used as income weights cover only the four areas that publish income data.
Dwelling stock, incomes, ages and pensioner shares span the four that publish them. Where a column is a
ratio, numerator and denominator cover the same areas — which is why asuntokuntia is the 774 that pairs
with the dwelling stock rather than the 779 all five areas report. The column
alueiden_mediaanitulojen_painotettu_keskiarvo_eur (€19,942 in 2024) is an adult-count-weighted average
of four area medians: not a municipal median, and not Rautavaara Keskus's €19,774.
The income comparison is in a separate file, pienituloisimmat-alueet-2024.csv: 1,093 areas ordered from the lowest income, with population, median income, average age and the shares of pensioners, students and 18–29-year-olds.
The open API gives the same ordering without the population floor:
https://suomiatlas.com/api/v1/rankings?variableCode=hr_mtu&year=2024&order=bottom&limit=10.
That list differs from this article's, deliberately so: without the 1,000-resident floor the bottom fills
with areas of a few dozen people, where one household moving decides the median. Unfiltered, Rautavaara
Keskus is the 123rd lowest of 2,944 areas.
Source: Statistics Finland, Paavo open data by postal code area and dwelling prices of old dwellings in housing companies (CC BY 4.0). Figures re-checked against the Statistics Finland API on 2026-08-23.
Analysis: Suomiatlas. Questions and corrections: [email protected]