Finland's fastest-growing districts are falling behind on income
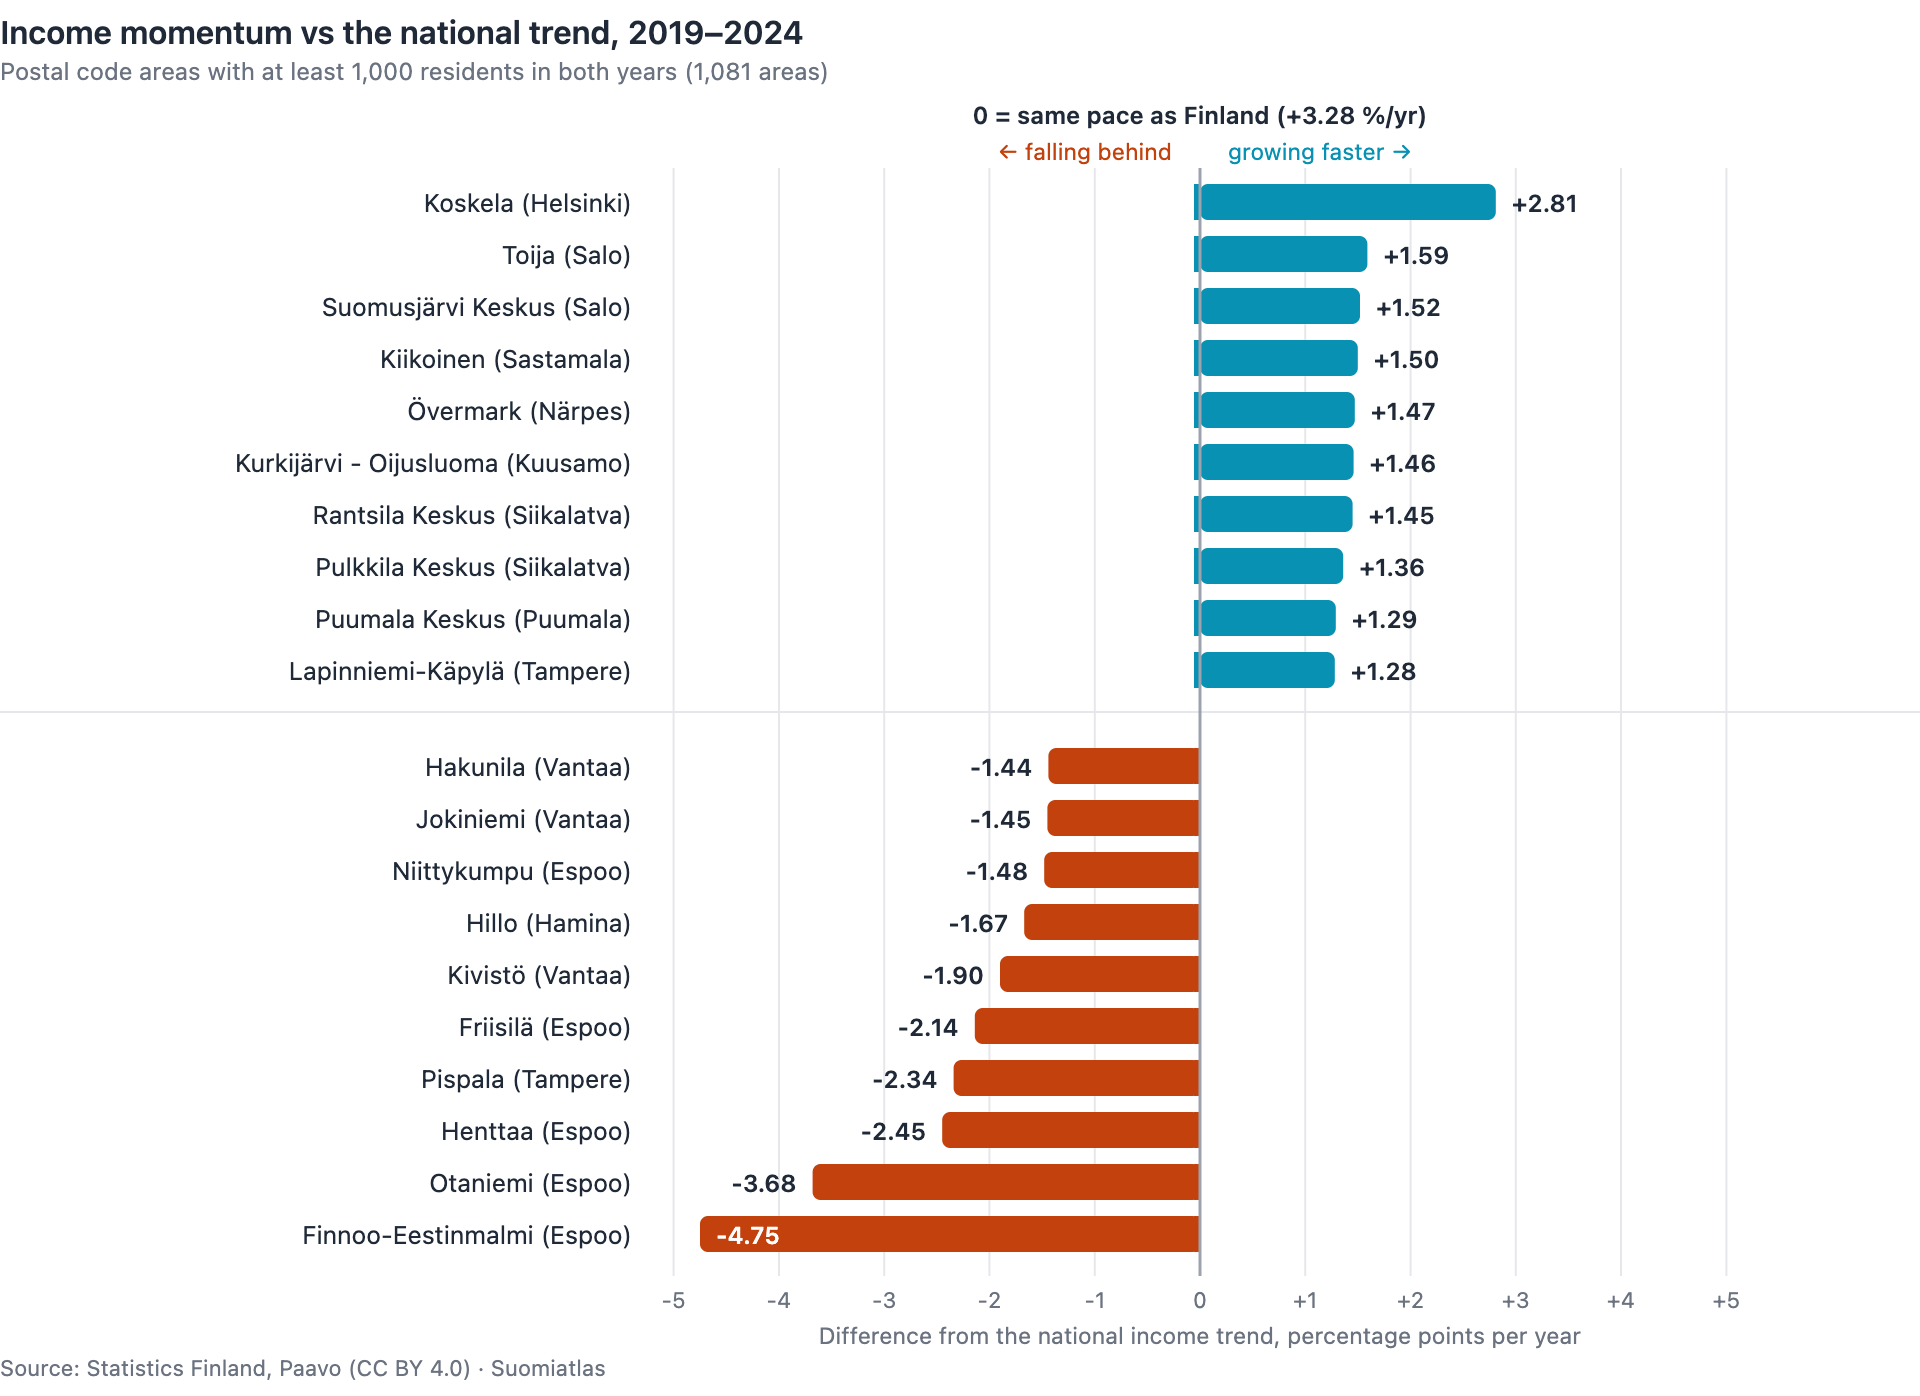
Finnoo-Eestinmalmi in Espoo grew from 2,210 residents to 4,620 in five years. Over the same period its median income fell 4.75 percentage points a year behind the national trend — further than any other Finnish postal code area with at least 1,000 residents.
That does not mean anyone got poorer. It means different people live there now.
What the number measures
For every postal code area we compare the growth of its median income with the growth of the national figure, 2019 to 2024. Finland's population-weighted median income rose from €22,396 to €26,312, or 3.28 % a year — in nominal terms, before inflation. Zero on the chart means an area grew at exactly the national pace.
The chart covers the 1,081 areas with at least 1,000 residents in both 2019 and 2024. That floor matters: without it the top of the list is areas of 40–150 people, where a handful of movers swings the median. The same picture holds at floors of 500 or 1,500.
Koskela on top, new suburbs at the bottom
The fastest riser is Koskela in Helsinki: +2.81 percentage points a year, median income €19,915 → €26,753. The rest of the top ten are small rural centres.
At the other end are Finland's best-known construction sites: Finnoo, Henttaa in Espoo, Kivistö in Vantaa, Pispala in Tampere. All grew sharply — Henttaa from 4,751 to 7,410 residents, Pispala from 2,372 to 4,156.
Otaniemi in Espoo is its own case: median income in the student district is low (about €12,000), but the student share barely moved over the period, so student housing alone does not explain why it lagged.
How strong is the pattern
Among the larger areas, 63 % of the fastest-growing decile fell behind the national trend, by an average of −0.32 percentage points a year.
Across the whole dataset, though, the relationship is weak: the correlation between population change and income momentum is only −0.14. Growth does not predict income momentum — this is a tendency at the top of the larger areas, not a rule.
What this does not show
The statistic compares the residents of two different years, not the same people. It cannot separate existing residents' incomes changing from different people moving in. For newly built districts the latter is the obvious explanation, but this data does not prove it.
The figures are nominal — inflation has not been removed. The comparison is relative, so inflation affects both sides equally. It is an endpoint comparison of 2019 and 2024, ignoring the years between. And a postal code area is not a neighbourhood: the boundaries follow postal delivery.
Check it yourself
The full dataset is downloadable as CSV above — all 2,922 areas, including those excluded here by the population floor.
The metric is also available straight from the API:
https://suomiatlas.com/api/v1/rankings?variableCode=income_momentum_5y&year=2024&order=bottom&limit=10.
Note that the API applies no population floor, so its extremes are the small areas this article
filters out.
Source: Statistics Finland, Paavo dataset (CC BY 4.0). The chart and the data may be republished freely with attribution.
Analysis: Suomiatlas. Questions and corrections: [email protected]