Finnish studio flats have lost a fifth of their real value since 2022
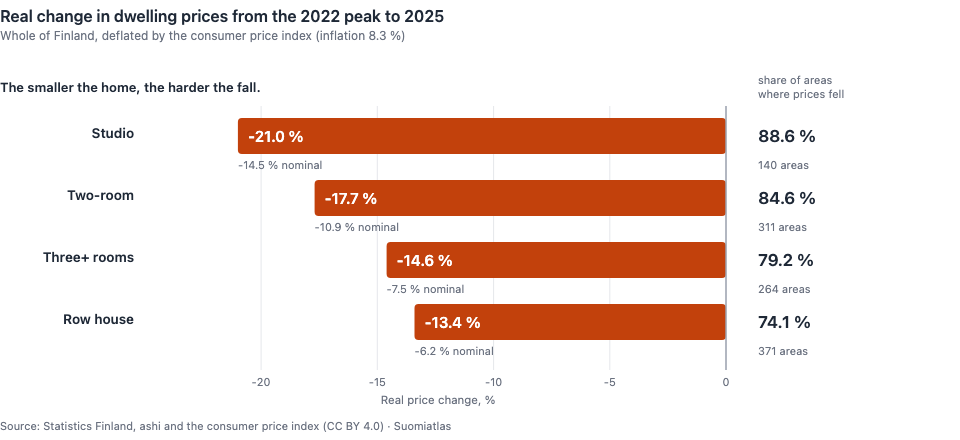
The average studio flat in Finland sold for €3,748 per square metre in 2022. In 2025 it sold for €3,205. That is a 14.5 % fall in nominal terms — but once the 8.3 % inflation in between is taken out, the real price of a studio has fallen 21.0 %.
The same thing happened to every dwelling type, but not equally. The smaller the home, the harder the fall.
What the number measures
2022 was the price peak for three of the four dwelling types. Studios peaked nationally a year earlier, in 2021, so measuring them from 2022 understates their fall rather than exaggerating it.
Real price means the price with inflation removed. Finland's consumer price index rose from 113.36 to 122.74 between 2022 and 2025, or 8.3 %. A flat whose nominal price barely moved has still lost purchasing power.
These are prices actually paid for existing flats, not asking prices or valuations. Detached houses are not included at all — they are a separate statistic.
The smaller the home, the harder the fall
The same ordering shows up three independent ways.
| Dwelling type | Whole country, real | Whole country, nominal | Areas where nominal prices fell |
|---|---|---|---|
| Studio | −21.0 % | −14.5 % | 88.6 % (140 areas) |
| Two-room | −17.7 % | −10.9 % | 84.6 % (311 areas) |
| Three+ rooms | −14.6 % | −7.5 % | 79.2 % (264 areas) |
| Row house | −13.4 % | −6.2 % | 74.1 % (371 areas) |
The national figures and the area-level figures come from different Statistics Finland tables, so they corroborate each other rather than repeating one calculation.
The right-hand column answers the obvious objection: a national average could be moved by one large market. It wasn't. For studios, prices fell in nearly nine areas out of ten.
The comparison covers areas with at least 15 transactions in both 2022 and 2025. The same ordering holds at floors of 10, 20 and 30.
Where the fall was steepest
The steepest individual drops are studios in the commuter municipalities and outer suburbs around Helsinki: in central Kirkkonummi a studio square metre fell from €3,412 to €1,920, and in Koivukylä-Havukoski in Vantaa from €2,275 to €1,582. For two-room flats the steepest falls are in central Imatra and Mikkola in Vantaa.
This is not only a cheap-areas phenomenon. Of the 52 Helsinki postal code areas with a published studio price in both years, 51 fell. In Kaivopuisto-Ullanlinna, the most expensive area in the country, the studio square metre fell from €9,623 to €8,002.
Transaction volumes shrank too: the covered areas saw 65,768 sales in 2022 and 58,161 in 2025.
Where prices rose
Few places. Across the whole dataset, only 72 of 1,086 area-and-type pairs beat inflation. The clearest gains are in Rovaniemi and Oulu: in Niemelänkangas-Korvanniemi a studio square metre rose from €2,373 to €3,240, and in Kontinkangas in Oulu a two-room square metre from €768 to €1,314.
These start from a low base, so a small change in euros shows up as a large percentage. Worth remembering before drawing conclusions about any single area.
What this does not show
The statistic reports what was paid for the flats that sold in an area — not what any particular flat is worth. If the flats that happened to sell in 2025 were in worse condition than those sold in 2022, the average falls without any individual flat losing value. The transaction floor limits that noise but does not remove it.
The data covers flats and row houses only. Detached houses are absent, which is why most of Finland's postal code areas are missing entirely: the 2025 table covers 1,724 postal code areas of Finland's ~3,000 and publishes a price for 793 of them. A missing price does not mean nothing was sold — as well as thin trading, Statistics Finland excludes some sales from the price calculation and suppresses figures for disclosure reasons.
It is an endpoint comparison of 2022 and 2025, ignoring the years between. Transaction counts are based on transfer tax records from 2020 onward, so earlier years are not directly comparable.
This article does not forecast prices and is not investment or purchase advice.
Check it yourself
The full dataset is downloadable as CSV above: 2,129 rows covering 866 areas, one row per area and dwelling type, with both years' price and transaction count. That is more than 793 because it also includes areas priced in 2022 but not in 2025. It includes the areas excluded here by the transaction floor. The national figures and the inflation adjustment are in a separate file, koko-maa-2022-2025.csv.
The extremes can also be checked straight from the open API:
https://suomiatlas.com/api/v1/rankings?variableCode=housing_price_m2_studio_apartment&year=2025&order=top&limit=10.
Switch the year to 2022 for the same list at the peak — which is exactly how this article's figures
were built.
Source: Statistics Finland, dwelling prices (ashi) and the consumer price index (CC BY 4.0). The chart and the data may be republished freely with attribution.
Analysis: Suomiatlas. Questions and corrections: [email protected]