What a family-friendliness score is mostly made of: children and houses
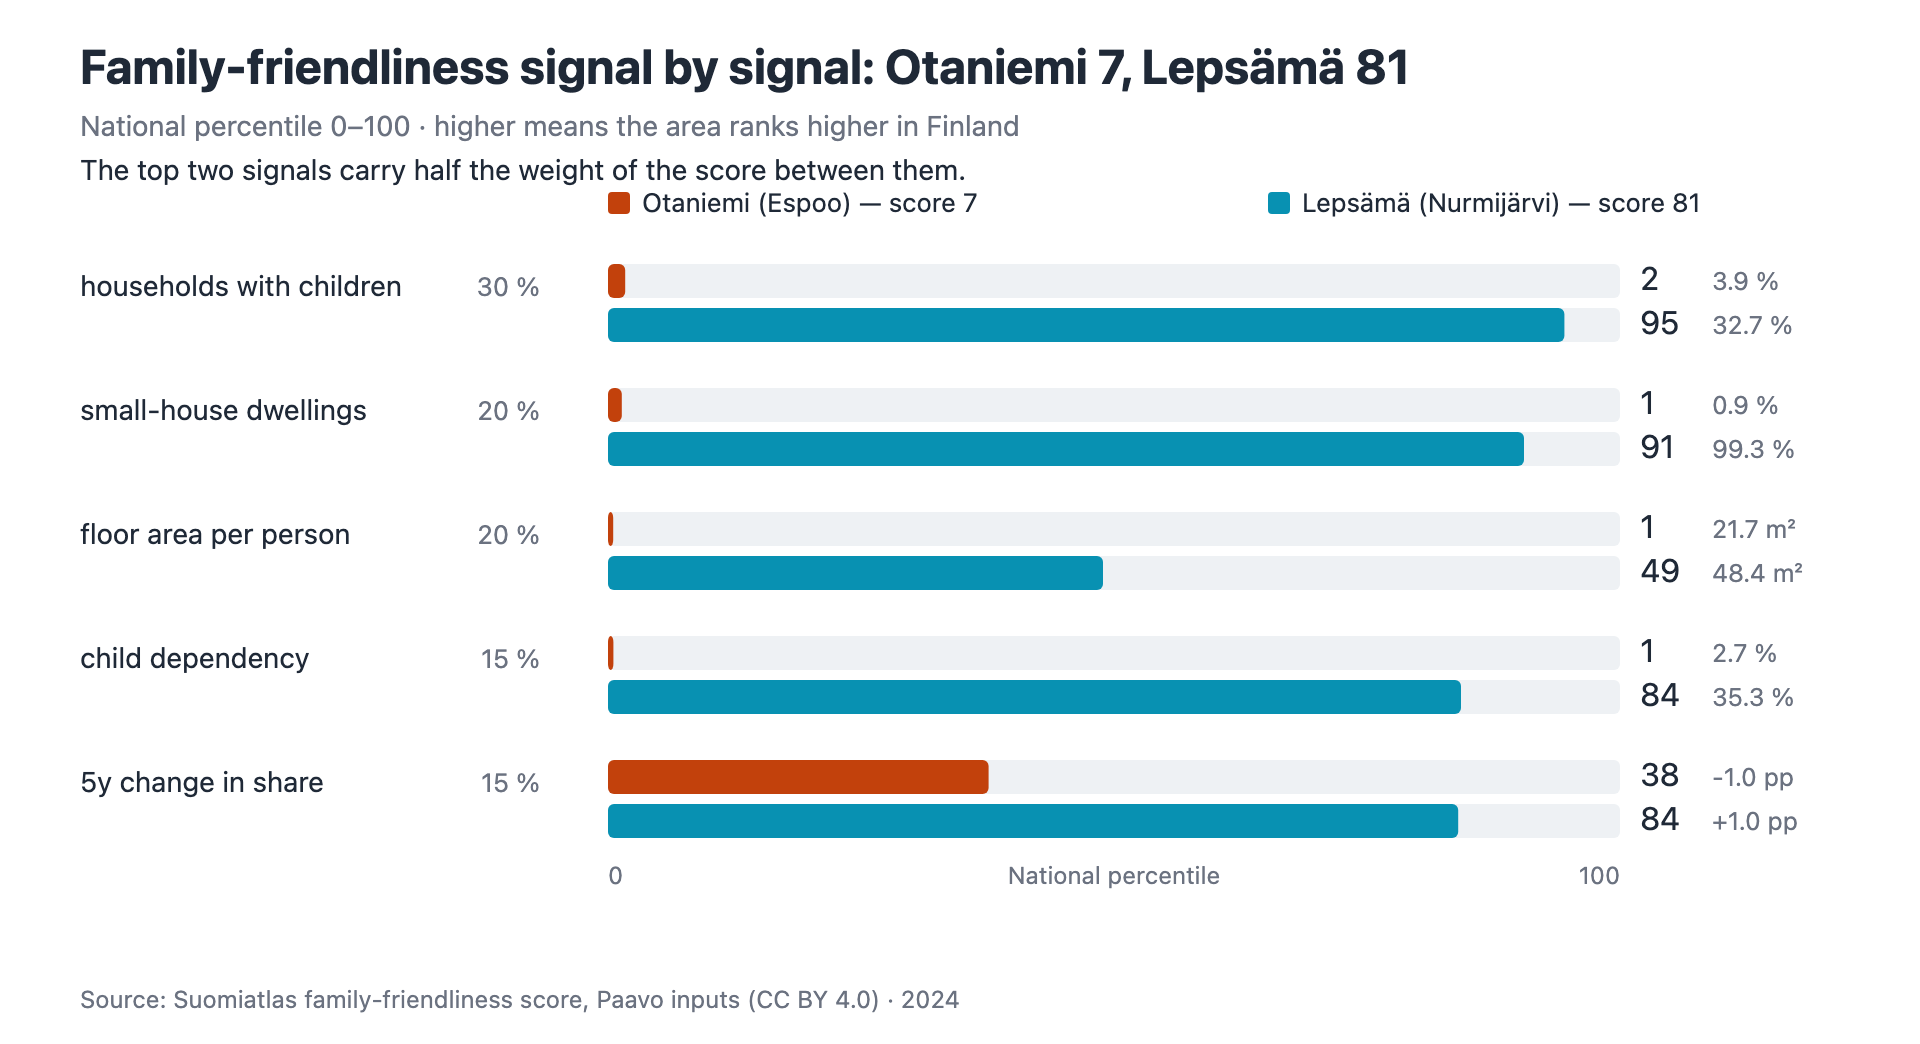
In 2024 Suomiatlas’s own 0–100 family-friendliness score ran from 81 down to 7 across the 1093 postal-code areas with at least 1000 residents. Lepsämä (Nurmijärvi) is highest, Otaniemi (Espoo) lowest. The score is Suomiatlas’s own composite, not an official Statistics Finland or Paavo statistic.
What the score measures
The score combines five signals, turned into national percentiles and weighted: the share of households with children, small-house dwellings, floor area per person, child dependency, and the five-year change in the small-child household share. The chart shows how much each one counts. Data year 2024.
None of these signals measures migration. The last one is a change in a share, not a flow: births, children growing out of the age band and any change in the number of households move it just as much. The data contains no moves.
The score is computed for every area where it can be — 2811 areas in 2024. This article includes only areas with at least 1000 residents, leaving 1093. Because that pool is smaller, an area always ranks higher here than in the full set: Lepsämä is first in this article but 14th of all 2811. The table shows both.
2024 top and bottom
| Rank here | Postal-code area | Municipality | Score 2024 (0–100) | Rank of all 2811 |
|---|---|---|---|---|
| 1/1093 | 01830 Lepsämä | Nurmijärvi | 81 | 14/2811 |
| 2/1093 | 06830 Kulloonkylä | Porvoo | 81 | 15/2811 |
| 3/1093 | 95500 Vojakkala - Yli-Liakka | Tornio | 81 | 16/2811 |
| ⋯ | ⋯ | ⋯ | ⋯ | ⋯ |
| 1091/1093 | 00500 Sörnäinen - Harju | Helsinki | 8 | 2807/2811 |
| 1092/1093 | 00510 Alppila - Vallila | Helsinki | 8 | 2808/2811 |
| 1093/1093 | 02150 Otaniemi | Espoo | 7 | 2809/2811 |
The three leaders all display as 81 because the raw scores round to the same integer. Otaniemi is a campus area, not automatically a city centre. Lepsämä population 2394; Otaniemi 4661.
Why the scores diverge
Otaniemi vs Lepsämä: share of households with children 3.9% → 32.7%, small-house dwellings 0.9% → 99.3%, floor area 21.7 → 48.4 m²/person, child dependency 2.7% → 35.3%, change in the small-child household share −1.0 → +1.0 percentage points.
A small-house majority is not enough on its own. That signal carries only 20% of the weight, and 740 of the 1093 areas compared are small-house-majority — of those, 231 score below the median of 43.9. The ten lowest-scoring areas are all densely built city areas — among them central Jyväskylä, Kallio in Helsinki and Otaniemi in Espoo. Comparisons are best among nearby areas, not against a national middle.
Two areas, 2015–2024
The score holds still. Over ten years Lepsämä moved within 71–81 and Otaniemi within 6–13. Each area's own swing is at most ten points, while the gap between them is 58 — an area's score is a property of the area, not a number that bounces year to year. The comparison set changes each year, so ranks from different years are not comparable — the scores are.
Lepsämä (score): 76 (2015), 81, 78, 77, 73, 72, 71, 72, 78, 81 (2024). Otaniemi: 6, 6, 10, 12, 13, 12, 10, 7, 7, 7.
Check it yourself
The score and its rank are public: on the map and in the API
(/api/v1/postal-codes/<code>/composites). The area pages do not show them
yet, so the full 2024 ranking is downloadable as CSV above:
lapsiystavallisyys-2024.csv.
Source: Suomiatlas family-friendliness composite; inputs Statistics Finland, Paavo (CC BY 4.0). Chart and data may be republished with attribution.
Analysis: Suomiatlas. Questions and corrections: [email protected]