WHO PM2.5 guideline exceeded in 15 of 33 Finnish municipalities in 2025
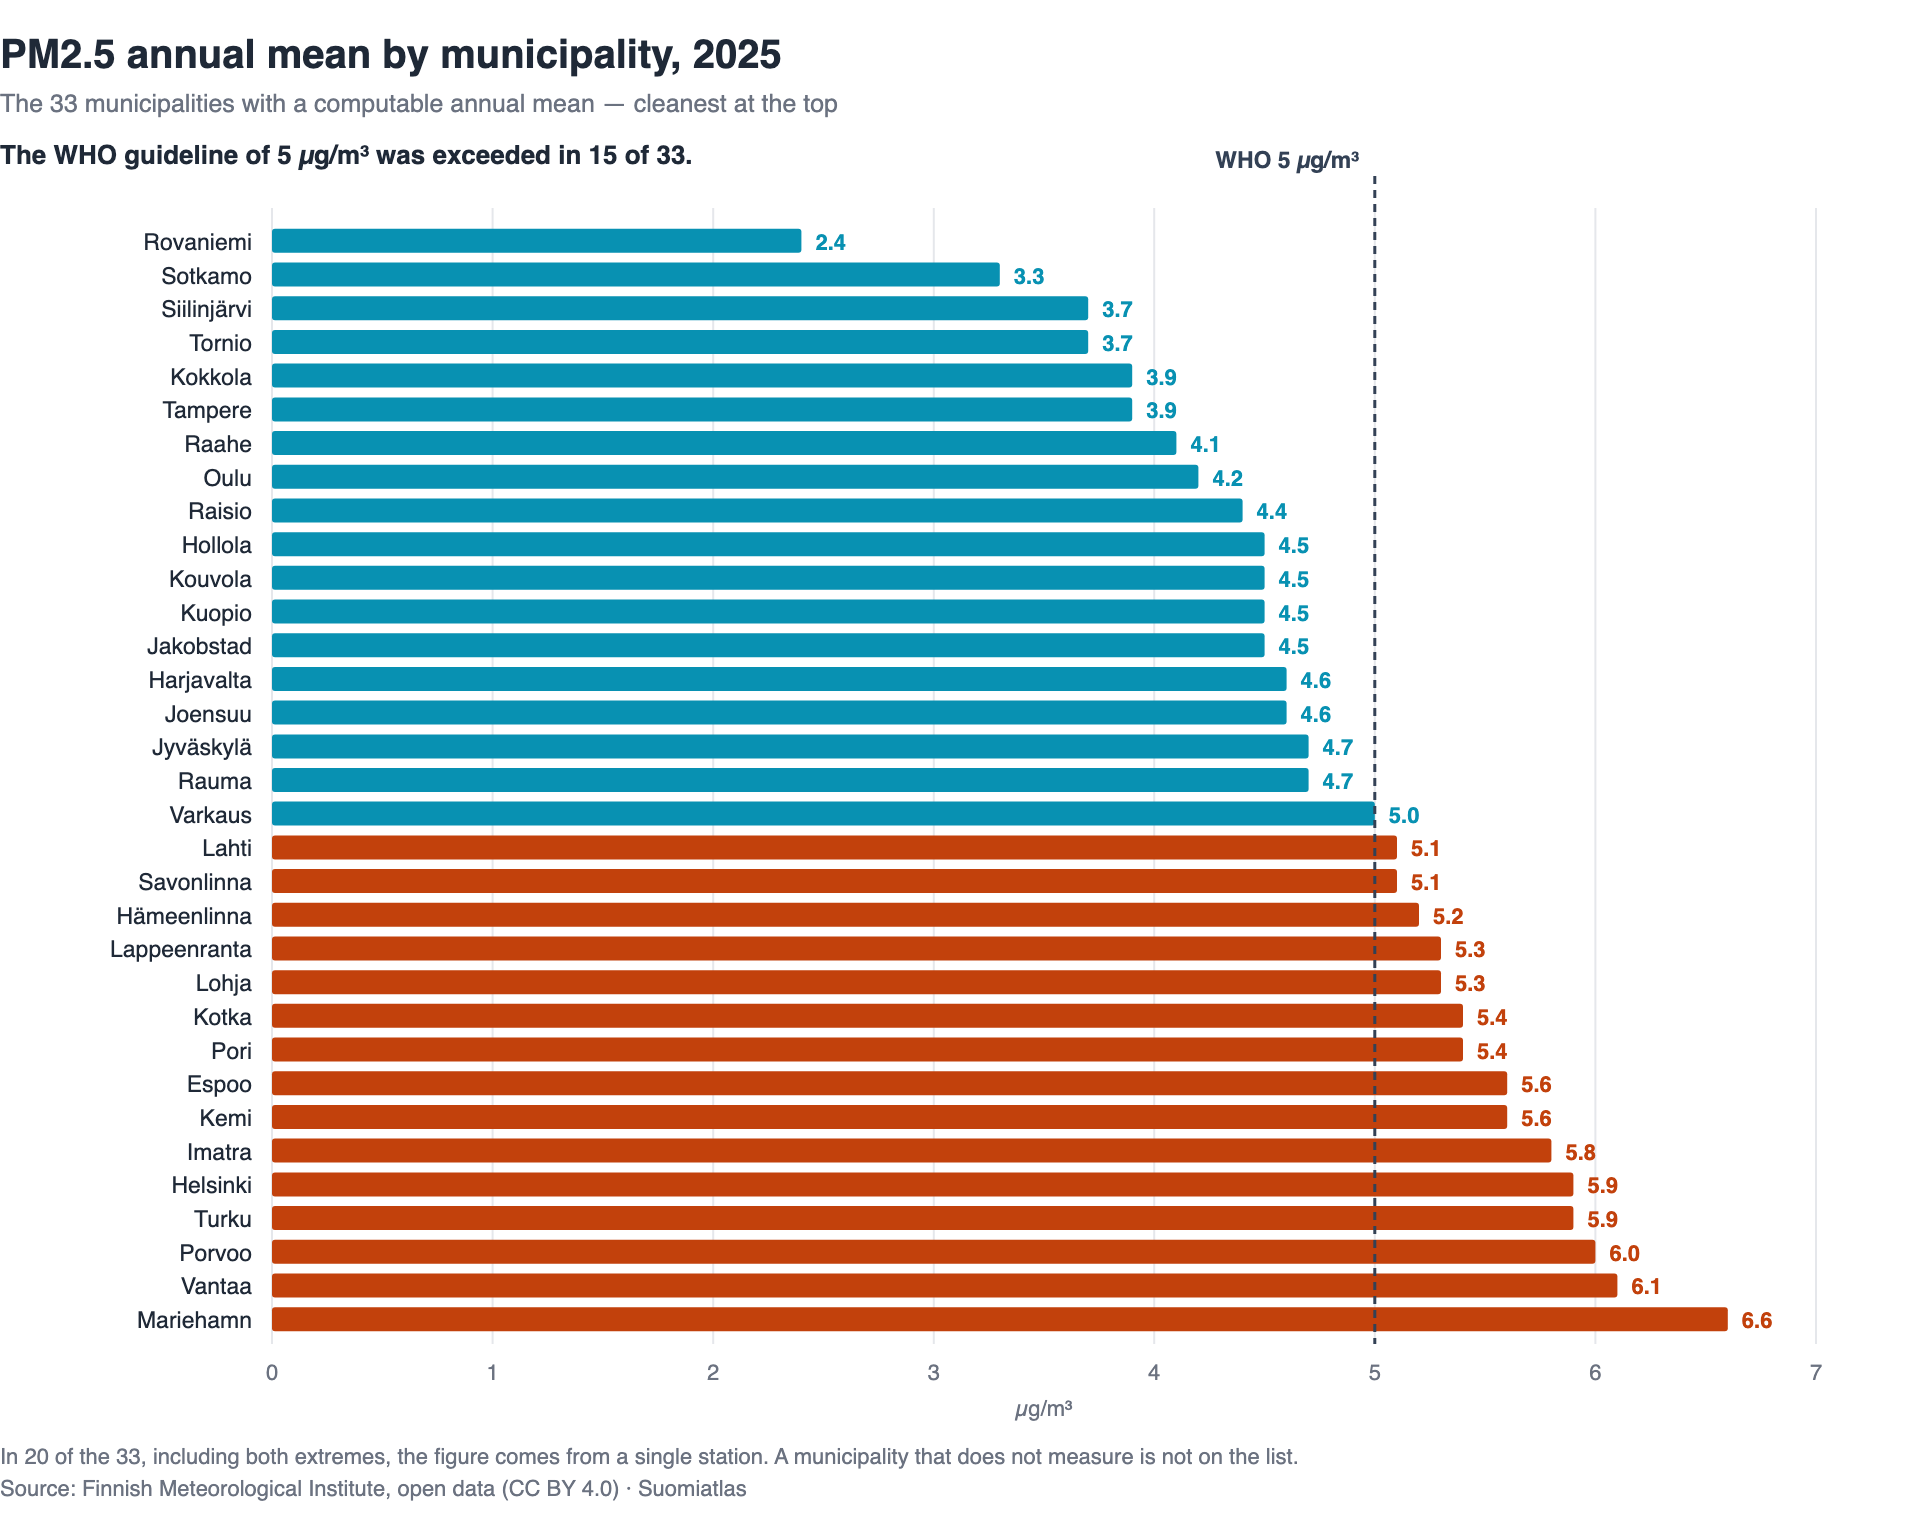
The WHO 2021 PM2.5 annual guideline of 5 µg/m³ was exceeded in 2025 in 15 of the 33 Finnish municipalities where an annual mean could be computed. The cleanest of those was Ranua at 2.4 µg/m³, and the highest figure was Mariehamn's 6.6 µg/m³.
This is 33 municipalities, not the whole country. Finland has 308, and only 61 have an air quality station — of which 34 had one measuring PM2.5 in 2025. An annual mean also needs valid readings for at least 75% of the year's hours, and in one of those 34 the only PM2.5 station fell short. That leaves 33.
The 2025 ranking
A municipality's figure is the 2025 median of its stations, to 1 decimal. Ranking and WHO comparison use 2025 only.
| Municipality | 2025, µg/m³ | Stations |
|---|---|---|
| Ranua | 2.4 | 1 |
| Sotkamo | 3.3 | 1 |
| Siilinjärvi | 3.7 | 4 |
| Tornio | 3.7 | 2 |
| Kokkola | 3.9 | 2 |
| Tampere | 3.9 | 3 |
| Raahe | 4.1 | 1 |
| Oulu | 4.2 | 1 |
| Raisio | 4.4 | 1 |
| Hollola | 4.5 | 1 |
| Kouvola | 4.5 | 1 |
| Kuopio | 4.5 | 5 |
| Jakobstad | 4.5 | 1 |
| Harjavalta | 4.6 | 2 |
| Joensuu | 4.6 | 1 |
| Jyväskylä | 4.7 | 2 |
| Rauma | 4.7 | 1 |
| Varkaus | 5.0 | 1 |
| Lahti | 5.1 | 3 |
| Savonlinna | 5.1 | 1 |
| Hämeenlinna | 5.2 | 1 |
| Lappeenranta | 5.3 | 5 |
| Lohja | 5.3 | 1 |
| Kotka | 5.4 | 2 |
| Pori | 5.4 | 1 |
| Espoo | 5.6 | 3 |
| Kemi | 5.6 | 1 |
| Imatra | 5.8 | 1 |
| Helsinki | 5.9 | 6 |
| Turku | 5.9 | 1 |
| Porvoo | 6.0 | 1 |
| Vantaa | 6.1 | 2 |
| Mariehamn | 6.6 | 1 |
Varkaus at 5.0 µg/m³ does not exceed the guideline: an exceedance is a rounded value greater than 5.0. Seventeen fall below the guideline, Varkaus sits level with it, and 15 exceed it: Lahti 5.1, Savonlinna 5.1, Hämeenlinna 5.2, Lappeenranta 5.3, Lohja 5.3, Kotka 5.4, Pori 5.4, Espoo 5.6, Kemi 5.6, Imatra 5.8, Helsinki 5.9, Turku 5.9, Porvoo 6.0, Vantaa 6.1 and Mariehamn 6.6.
The same 15 exceed on the unrounded medians, so the count does not turn on the rounding.
None of the 33 exceeded the EU limit in force, 25 µg/m³, or the 10 µg/m³ limit to be attained by 2030. Even the highest figure, 6.6 µg/m³, is well below both.
The single-station municipalities
In 20 of the 33, the figure comes from one station — including the cleanest, Ranua, and the highest, Mariehamn. In both cases it is worth knowing which station.
Ranua's 2.4 µg/m³ comes from one monitor, Ranua Suhanko Palovaara. It sits 31 km from the centre of Ranua in forest, so the figure is a reading from that site rather than from the village itself.
Mariehamn's 6.6 µg/m³ likewise comes from a single station, Ålandsvägen.
For contrast, Helsinki's 5.9 µg/m³ is the median of six stations, which range from 5.3 at Katajanokka 2 to 7.0 at Mannerheimintie. Neither end sets the municipality figure — the figure is a median, not the highest or lowest station.
How the figures are calculated
The quantity is PM2.5: airborne particulate matter under 2.5 µm in diameter. The Finnish Meteorological Institute publishes it as hourly means, not as an annual mean, so Suomiatlas computes each station's annual mean from those hourly observations. A municipality's value is the median of its stations for that year, to 1 decimal. With one station, that station is the municipality value.
A station counts only when that year's observations were fetched in full and an annual mean can be computed. The 2025 set is 33 municipalities and 61 stations. For five stations no mean was computed, because fewer than 75% of the year's hours are valid. There is no minimum station count and no population floor.
The WHO annual guideline is 5.0 µg/m³. The EU annual limit in force is 25 µg/m³, and the limit to be attained by 2030 is 10 µg/m³.
What the figures do not say
Finland has 308 municipalities. 61 have an air quality station, and 37 have a computable PM2.5 annual mean in some year. In 2025, 33 did. A municipality that does not measure is neither clean nor dirty here — it is simply not on the list.
The set grew every year from 2021 to 2025: in 2021 it was 21 municipalities and 33 stations, in 2025 it was 33 and 61. Over a longer run it has also shrunk in places. So rankings from different years cannot be compared, and this article cannot tell you whether air quality in Finland has improved or worsened.
Check it yourself
The figures for all 33 municipalities are downloadable as CSV above: pm25-kunnittain-2025.csv. Rows are ordered by the 2025 median, cleanest first, with each municipality's station count. The chart is drawn from this same file. The table in the article is written by hand, and its 33 rows were checked line by line against that file.
The API gives the same ordering:
https://suomiatlas.com/api/v1/air-quality/kunta-ranking?pollutant=aq_pm25_avg&year=2025.
It returns the same 33 municipalities in the same order.
If you use an AI assistant that supports MCP, Suomiatlas runs a server for it — see the setup instructions. Ask it for the air quality in any Finnish municipality or postal code and it returns the latest annual mean, its WHO and EU comparison, and the station the reading comes from. It answers one place at a time; the ranking above comes from the API endpoint.
Source: Finnish Meteorological Institute (FMI), open data (CC BY 4.0). All 33 figures were checked against Suomiatlas's published API on 31 August 2026.
Analysis: Suomiatlas. Questions and corrections: [email protected]